Internet Free Zones [328]


Less than one percent of the population has access to the Internet in these countries.

First Female Parliamentarian [279]


The red line on this globe traces temporally, country by country, the first election of a female to parliament following the precedent set by Finland in 1907 through to 1946 when the first female parliamentarian in Japan was elected to office.

Mobile Teledensity 2006 [327]


Mobile phone density is shown in four levels:
Countries where people have less than 10 phones for 100 people are not covered; 10 to 50 phones per inhabitants are lightly crisscrossed; 51 to 99% is the next step and countries with more mobile phones than citizens have the highest density.

Regional Energy Consumption and GDP [331]


Regional energy consumption (red horizontal bars) is correlated with vertical bar graphs indicating GDP (Gross Domestic Product) figures. Arrows indicate the rate of increasing consumption. China is currently the world's largest coal consumer and is projected to be the largest energy consumer by 2023.

Car-free Countries [325]


Many industrialized nations have about half as many cars as citizens. Green overlaid countries have the least number of cars per capita: in these countries up to 11,000 inhabitants would have to share a single motor vehicle.

Nuclear Energy Dependency [162-4]


Violet parts of a given country represent the proportional dependency on atomic energy. The remainder (yellow) represents the reliance on conventional energy sources.

CO2 Spiral [30]


Between 1950 and 1986, annual carbon dioxide emissions have tripled. The principal source of
these emissions is fossil fuel combustion, but natural gas flaring and cement production also contributes to the rising level. Carbon dioxide is the major cause of the Greenhouse Effect.

Oil and Coal Reserves [323]


Black areas show loca tions of proven oil, coal, and gas reserves. The reserve amount is indicated as a red circle for oil and striped boxes for coal. Worldwide coal reserves amount to
three times oil reserves. Coal use is a major concern and factor in global warming scenarios.

Chemical and Energy Companies vs. Country [324]


Some company’s yearly gross income is larger than the entire GNP of a given country. Fifty-one of the top 100 economies are corporations not countries. 90% of all oil production capacity is owned by states.

Japanese Empire (Dai-tō-a Kyōeiken) [304]


The concept of a Greater East Asian Co-Prosperity Sphere ( 大東亜共栄圏 Dai-tō-a Kyōeiken) was an Japanese attempt to create a Great East Asia free of Western Colonialism. The concept was also used to justify Japanese military conquests during the Great Asia War or Pacific War (roughly corresponding to WWII and preceding conflicts 1937 to 1945).

Literacy [330]


Countries with a less than 90% literacy rate are proportionately blacked out. The blacked out area represents the illiterate portion of the population.

Starting a Business [299]


The Cost and Capital Required to Start a Business.
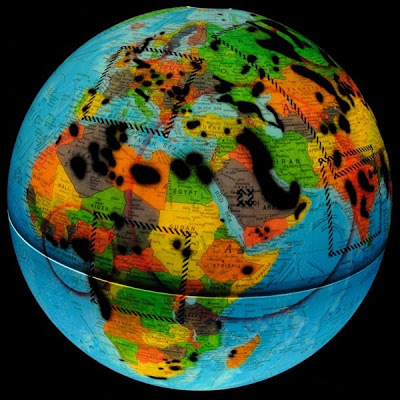
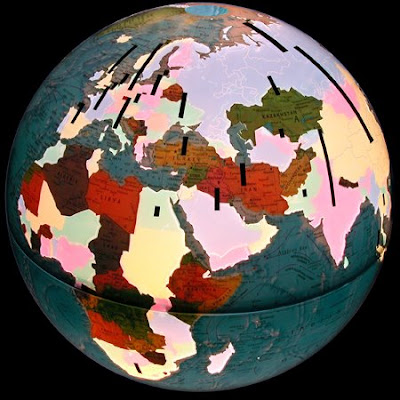
In many countries the cost of procedures and the minimum capital required to start a business are so high that setting up a firm legally is all but impossible for most entrepreneurs. In Angola, for instance, the cost of starting a business is almost 450 percent of income per capita, and the minimum capital required is close to 500 percent.
On the globe, countries are removed from their actual geographic location and positioned on a grid. Along the black longitude line, countries are arranged according to the cost required to start a business; the cost, as a percentage of income per capita, increases from north to south. Along the red latitude line, countries are arranged according to the capital required to start a business; the capital, as a percentage of income per capita, increases from west to east. (For some very large countries, the exact position on the grid is indicated by a bright dot.) The farther north and west a country appears on the grid, the more affordable it is to start a business.
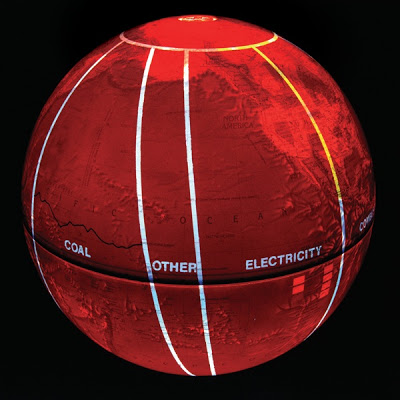
Night [41]


The military objectives of the US Air Force Defense Meteorological Satellite Program have created an aesthetic byproduct — a composite photo of the planet, taken during nighttime hours. More than 99% of these representations of actual light sources are indications of human activity on the planet. For example, this image includes more than a million man-made fires, most of them in the Third World, chiefly propagated for agricultural purposes. Population centers are easily identified; however, the amount of light represented here is not necessarily proportional to the population size. Imbalances arise due to unequal electrical consumption. Japanese consume 15 times as much electricity as Chinese per capita, and Americans consume 21/2 times more than Japanese do. This image also illustrates light pollution, a condition only astronomers have complained about so far.

Export Impediments [296]


Every country requires official approval before exporters can ship their products abroad. However, requiring many approvals increases the risk of corruption and delays. While the world average is around 11 signatures required for export, countries in Sub-Saharan Africa require nearly double that number, and some require four times as many. In contrast, OECD countries require an average of only about three signatures. “Signatures required for export” is a sub-indicator of the IFC/World Bank’s “Doing Business” ranking (www.doingbusiness.org). On the globe, each check mark represents five signatures required (check marks are sized to fit the available space).

Carbon Emissions Trading [283]


Indicated are countries that have signed and ratified the Kyoto Protocol, and are thus eligible for participation in carbon emissions trading. Countries emitting levels of CO2 over 100,000 Gg (gigagrams) are designated by lengths of black bars corresponding to their emission levels. Thick bars indicate twice the amount thin bars do.

3 Hour US Air Force Range [241]


The vast majority of the earth's territory can be reached by American jets within 3 hours due to a global network of air-bases and aircraft carriers.

South - North and South - South Investment Flows [294]


Cross-border trade is a key element in private sector development. Trade between emerging market countries, also called South-South trade, more than tripled between 1995 and 2003, rising from $15 billion to $46 billion. Trade from the South to the North also grew substantially, reaching $7 billion in 2003 (World Bank estimates).