Land Mines [67]


Red indicates countries where mines are in use; countries identified with the letter "M" are major producers of land mines.

Global Warming and Cooling [158]


1965 -1995 data: temperature changes over a 30-year period. Areas that experienced a temperature increase of up to 0.5ºC are white. Areas in which the temperature increased 0.6º - 1.0ºC are pink, and temperature increases of 1,1º - 1.5ºC are red. All areas in which the temperature decreased are shown in blue, equally bracketed.

Extended Exclusive Maritime Economic Zones [107]


According to the proposed, and heavily debated, International Maritime Law, nations may extend their exclusive economic jurisdiction 200 miles (370 km) into the seas. This law would roughly double the amount of the earth's surface available for exclusive economic development. Given that the rest of the oceans is subject to non-exclusive exploitation, only the seas beneath the ice caps would be effectively protected.

Fresh Water [3]


97.4 % of the world's water is ocean water. 2 % is accounted for by ice caps and glaciers, and about 0.6 % is ground water, which constitutes the entire fresh water reserves on earth. Lake water represents only 7 millionths of the world's water; clouds only 1 millionth, and river water 10% of a millionth.

Ocean Floor [5]


Eighty-five percent of the earth’s volcanic eruptions occur deep underwater along mid-ocean ridges.

Landlocked Nations [7]


These countries have one territorial condition in common: no access to the world's oceans. This has a fundamental impact on economics, social behavior, and perspective on the world. Many of the republics of the former Soviet Union are landlocked. Their recent independence has radically increased the number of countries, that suffer this unique condition.

Life Expectancy [8]


Life expectancy is a core indicator in the UN’s human development index. Japan has the highest life expectancy at 82 years. More than 30 of the countries with the lowest life expectancy are in Sub-Saharan Africa: here life expectancy averages 46 years.

Solar Exposure  [321]


The brighter the area the more sunshine it receive. Bright yellow areas are ideal for Solar Thermal Power (CST) generation.

Enclaves and Special Zones [245-2]


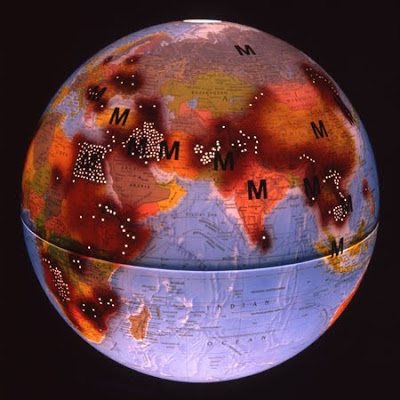
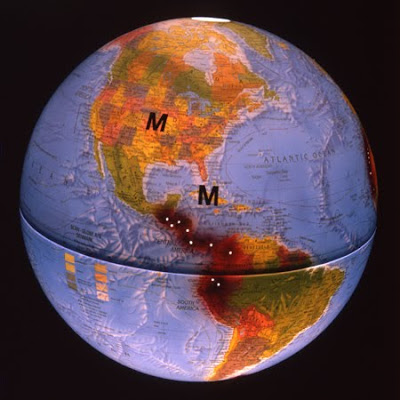
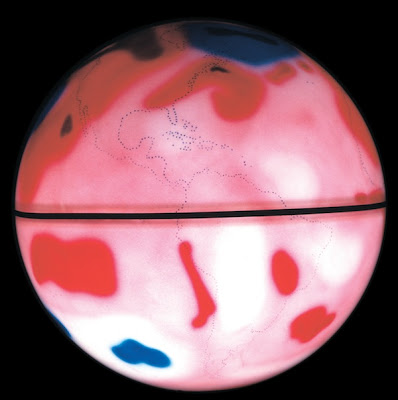
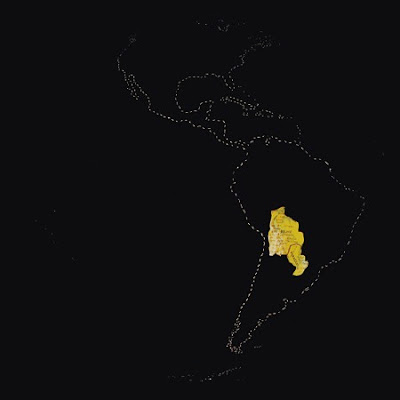
Special Economic Zones are a type of proto-state. They function as adapters zones to globalism. Ideally they are stripped of cultural, local, national, linguistic, fiduciary, monetary, regulatory, ethnic, and social barriers, idiosyncrasies, identities, and flavors. These Nationettes are run by corporations, governments, authorities, or organizations. At the same time they are incubators for new arrangements, agreements and contracts of social, commercial, and industrial infrastructure in a networked world. A network of SEZs would represent a structurally new, highly fluid state morphology - the antithesis to the nation state concept of the early 19th century.

Foreign Aid [247]


Thicker lines drawn from captial to capital indicate aidflow in excess of 66 million dollars per year. Thinner lines represent the 20 to 66 million bracket. Smaller amounts have generally been ignored unless they represent a significant portion of the donor country's budget.

Rainfall [233]


As drawn according to rainfall, a picture of our “waterworld” reveals contours that are subtly influenced by continental masses, but not beholden geography in any way whatsoever. Darkest regions receive on average more than 2000 millimeters of rain annually while white regions receive less than 100 millimeters. Arabian peninsular shown in the center of the perspective.

Non-Competitive Elections [227]


Highlighted areas indicate those countries that are democratic in name only. Dictatorships, Communist states, and military states either ban popular elections, disregard their results, or hand-pick the candidates. Floundering or corrupt representative democracies often do no better at generating competitive elections.

Overseas Chinese Network [271]


Highlighted are countries that have a population of more than 500,000 ethnic Chinese. Outlined countries have more than 60,000 Chinese. The total number of overseas Chinese is estimated to be above 50 million.

“Bad Carma” [211]


Traveling the roads of countries with a red cross is dangerous. The larger the cross, the higher the chance to continue any given trip in an ambulance and end up in a hospital or graveyard.

Watersheds [234]


The river systems and drainage basins on every continent have created watersheds of the world’s fresh water. Fueled by precipitation, and directed by continental geography, watersheds constitute the major reservoirs of fresh water and the channels through which water flows to the ocean.

Prison Populations [235]


The U.S. has recently usurped from Russia the dubious honor of highest rate of incarceration - almost 700. The number of inmates per 100,000 of the national population is represented for each country. 142 is the world average.

Red Tape - Impediments to Business [297]


One of the biggest roadblocks to economic growth and poverty reduction is excessive business regulation. Among the 155 economies measured in 2005/2006, it is easiest to do business in New Zealand and most difficult in the Democratic Republic of Congo.
On the globe, the top 25 performers in terms of the ease of doing business have no “red tape.” Countries ranked 26 through 50 are marked by one line of red tape, those ranked 51 through 80 have two lines, and those ranked 81 through 145 have three. The bottom 10 countries are covered in red lines – with the exception of Laos, these countries are all in Africa. Countries not measured in the report are marked by a black line.

Deserts [314]


The world's most arid regions occur along the tropics of cancer and capricorn.
Deserts are areas that receive precipitation of less than 250 mm p.a. The largest desert by this standard is Antarctica. Some deserts climates extend into the ocean. The waters adjacent to the Atacama in Chile are technically deserts.

Energy Generation/ Consumption [322]


87% of the world energy consumption is generated from fossil fuels (gas, coal, oil). The rest is equally divided between nuclear (6%) and hydro energy (7%).
Alternative energy sources such as wind, solar and ocean wave/tidal power account for barely 0.1 %. Only in Spain and Germany do these sources supply up to 1% of the total consumption.
Yellow-green: Nuclear - Black: Fossil - Blue: Hyrdo - Silver line: Alternative.
Breadth of bars indicate regional consumption volume.