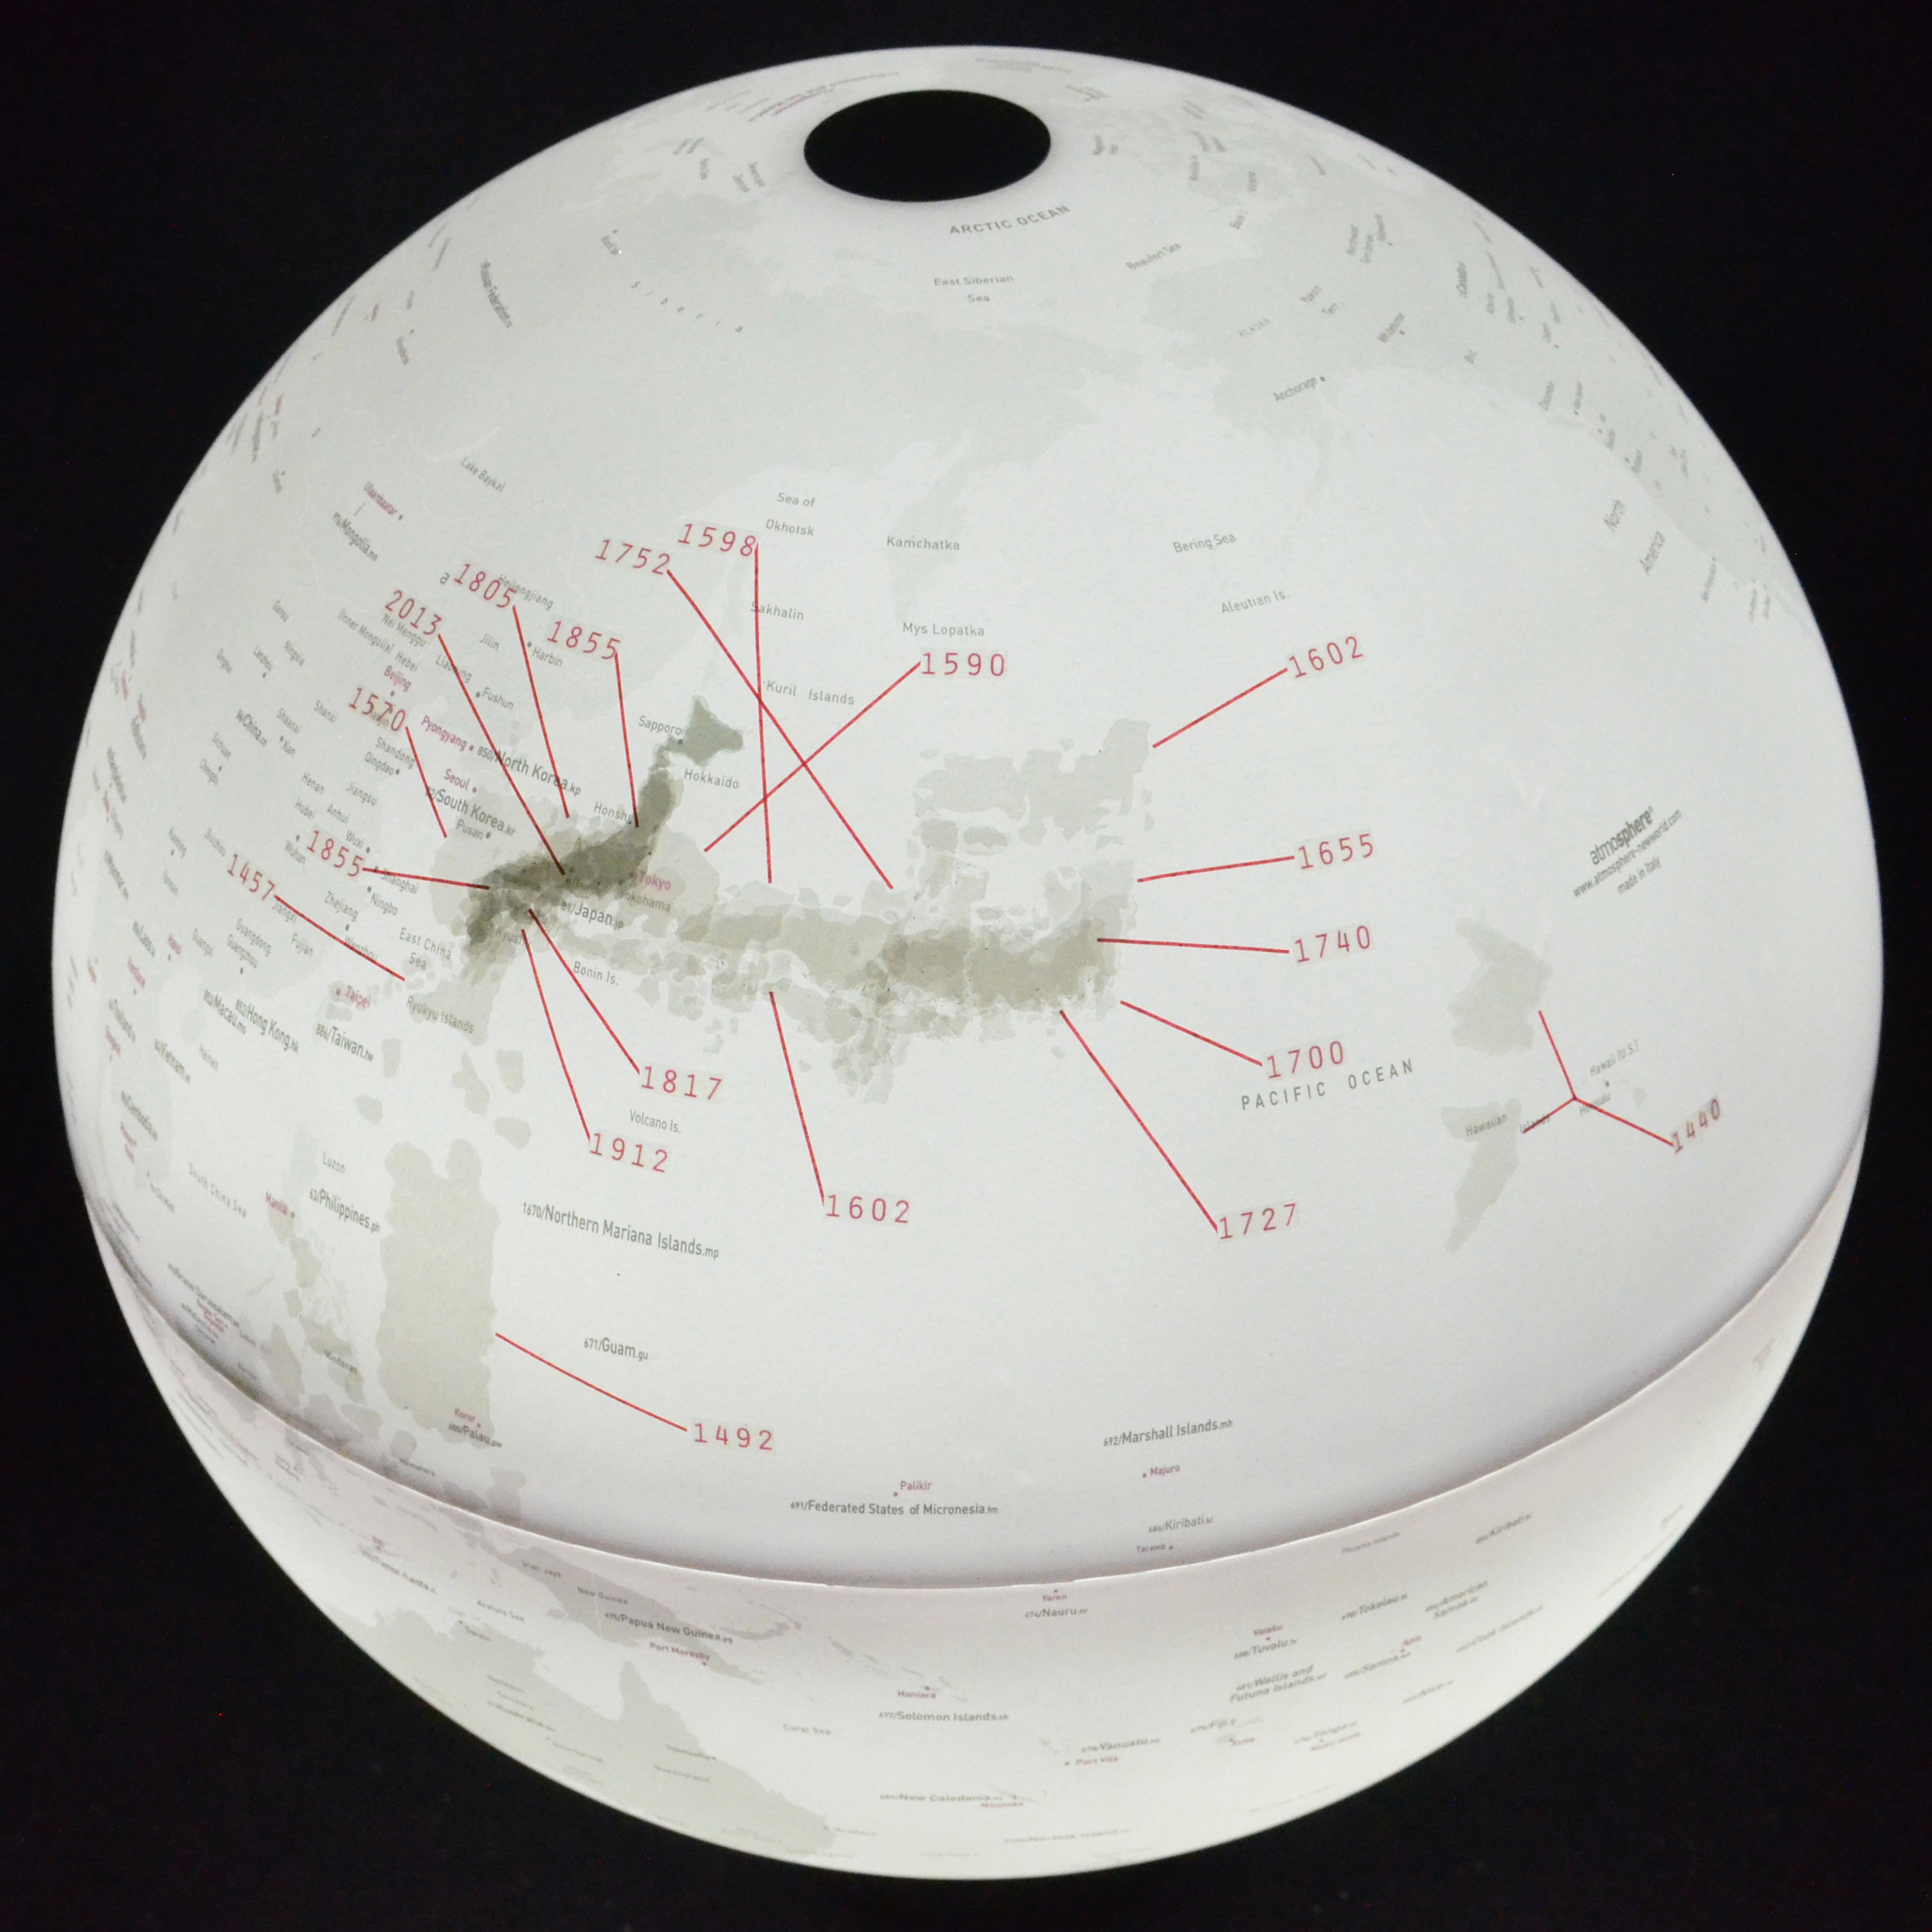
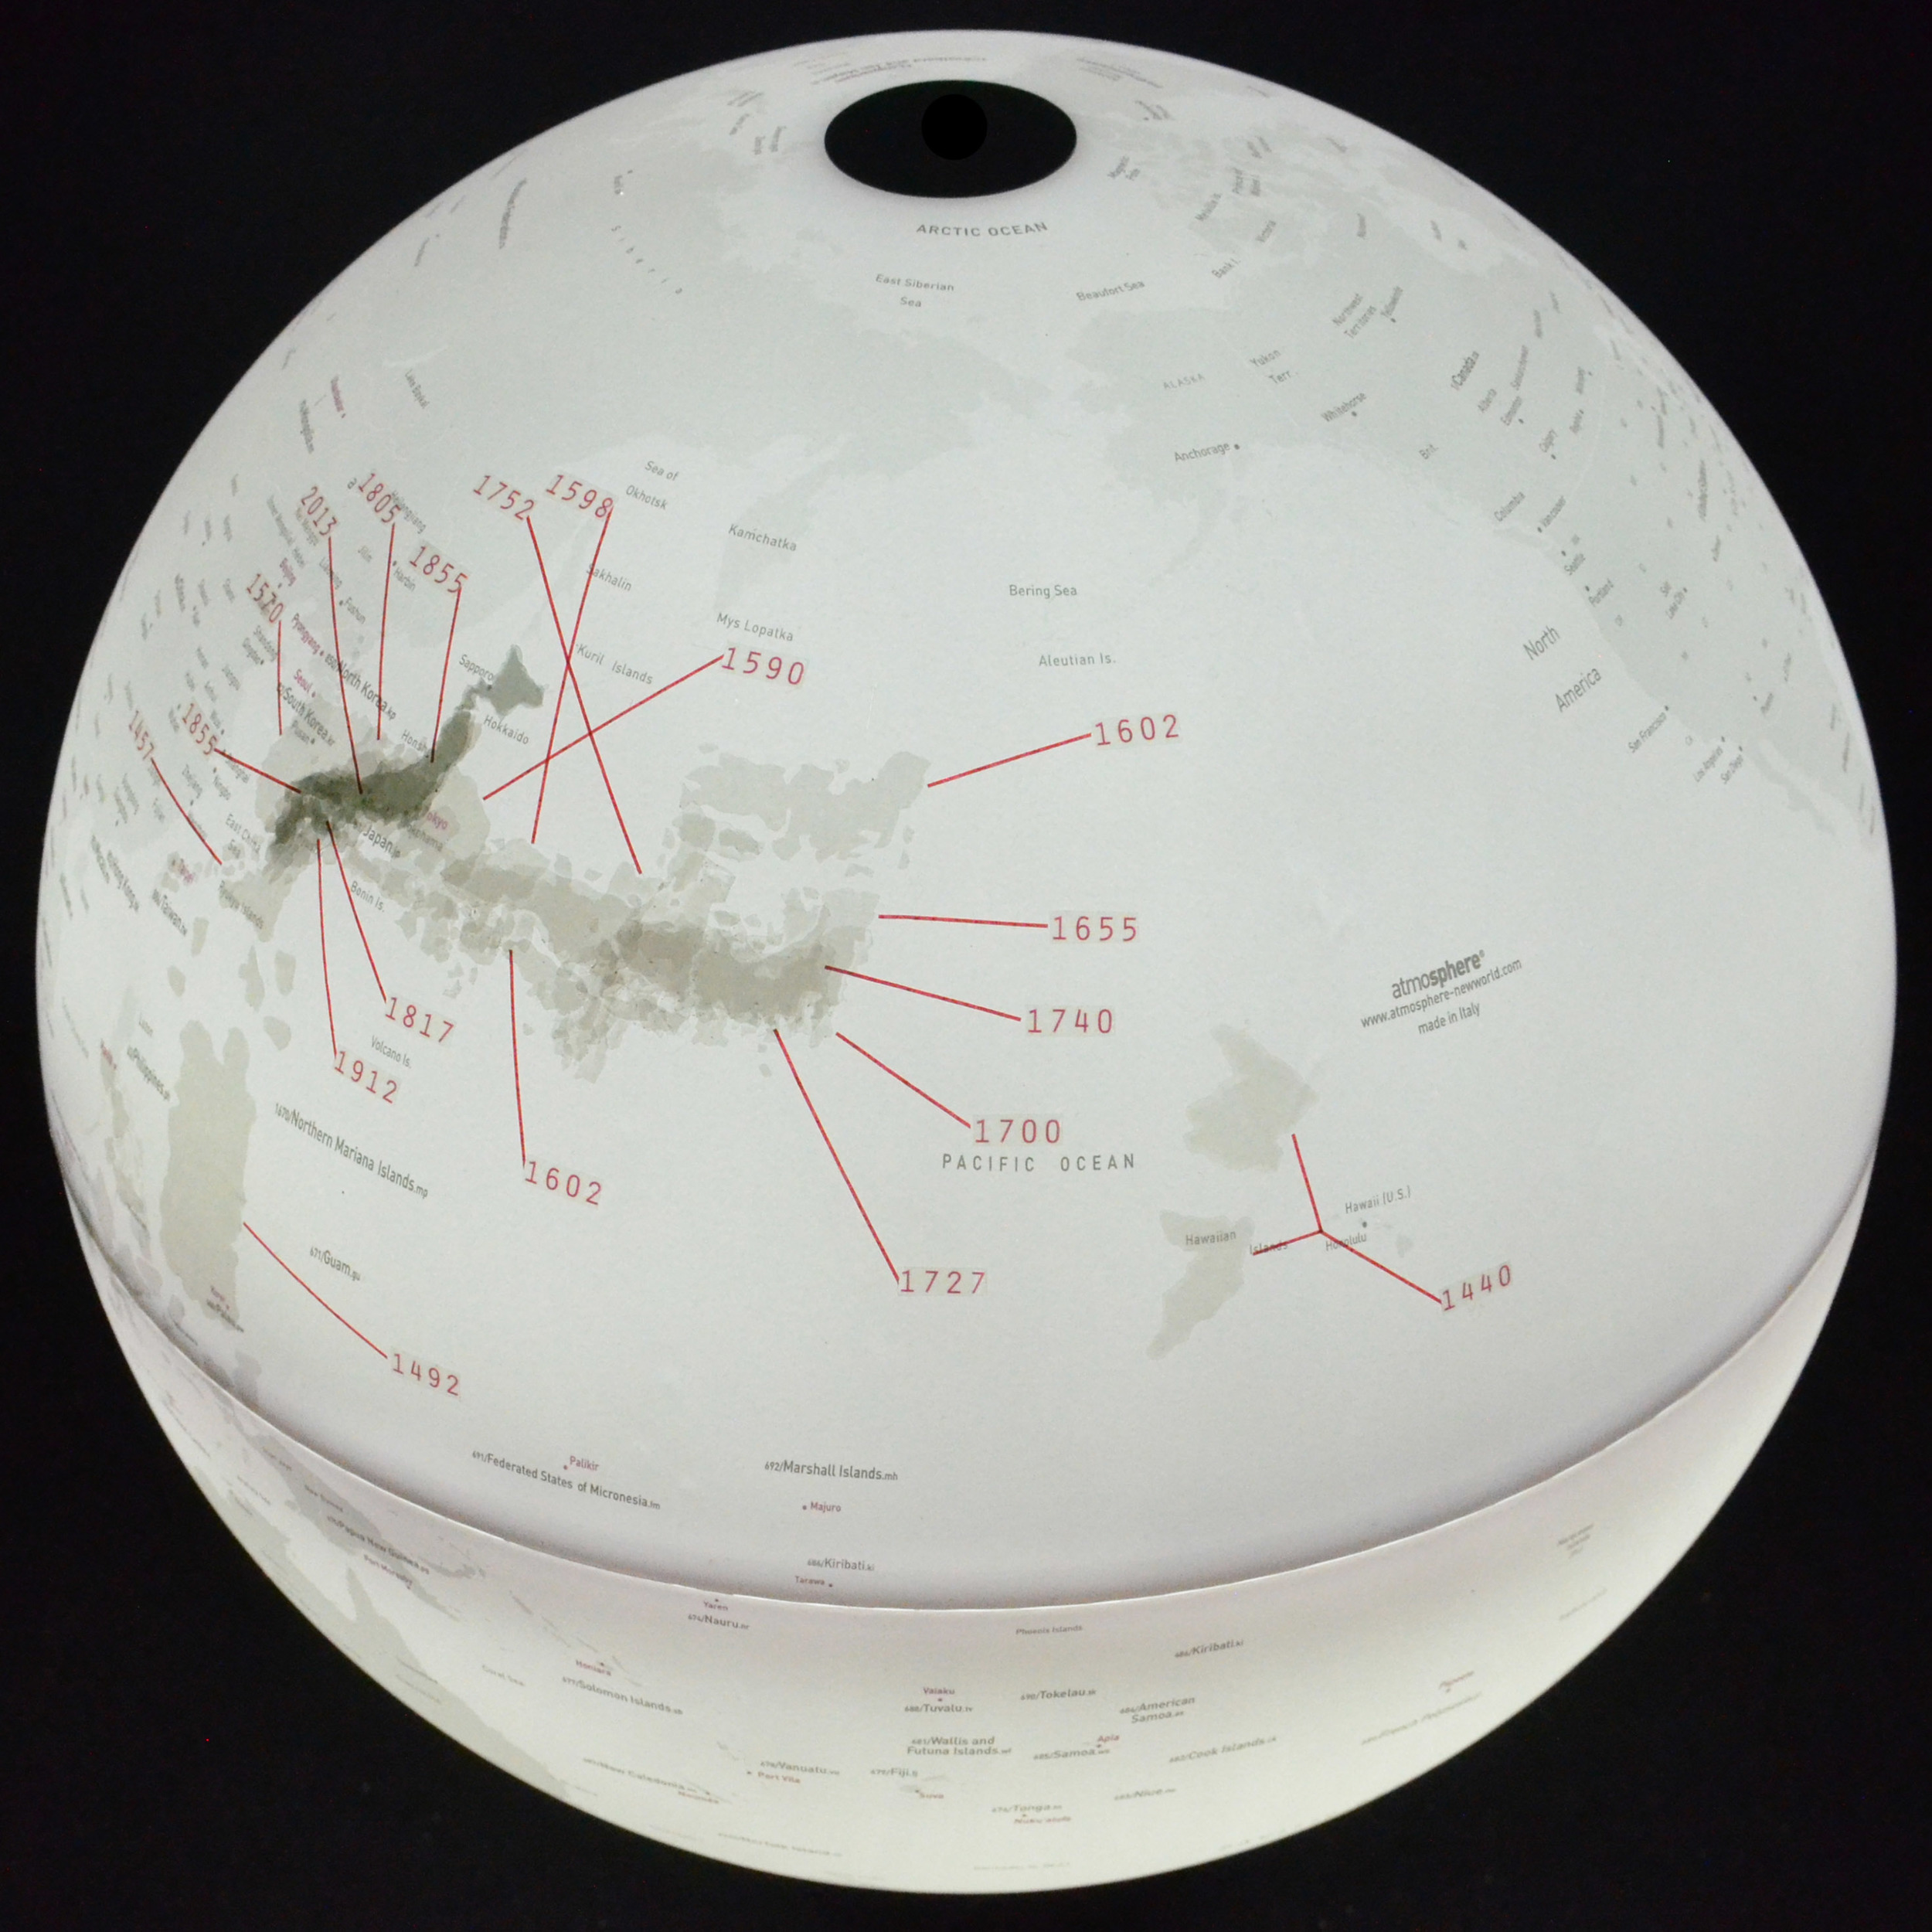
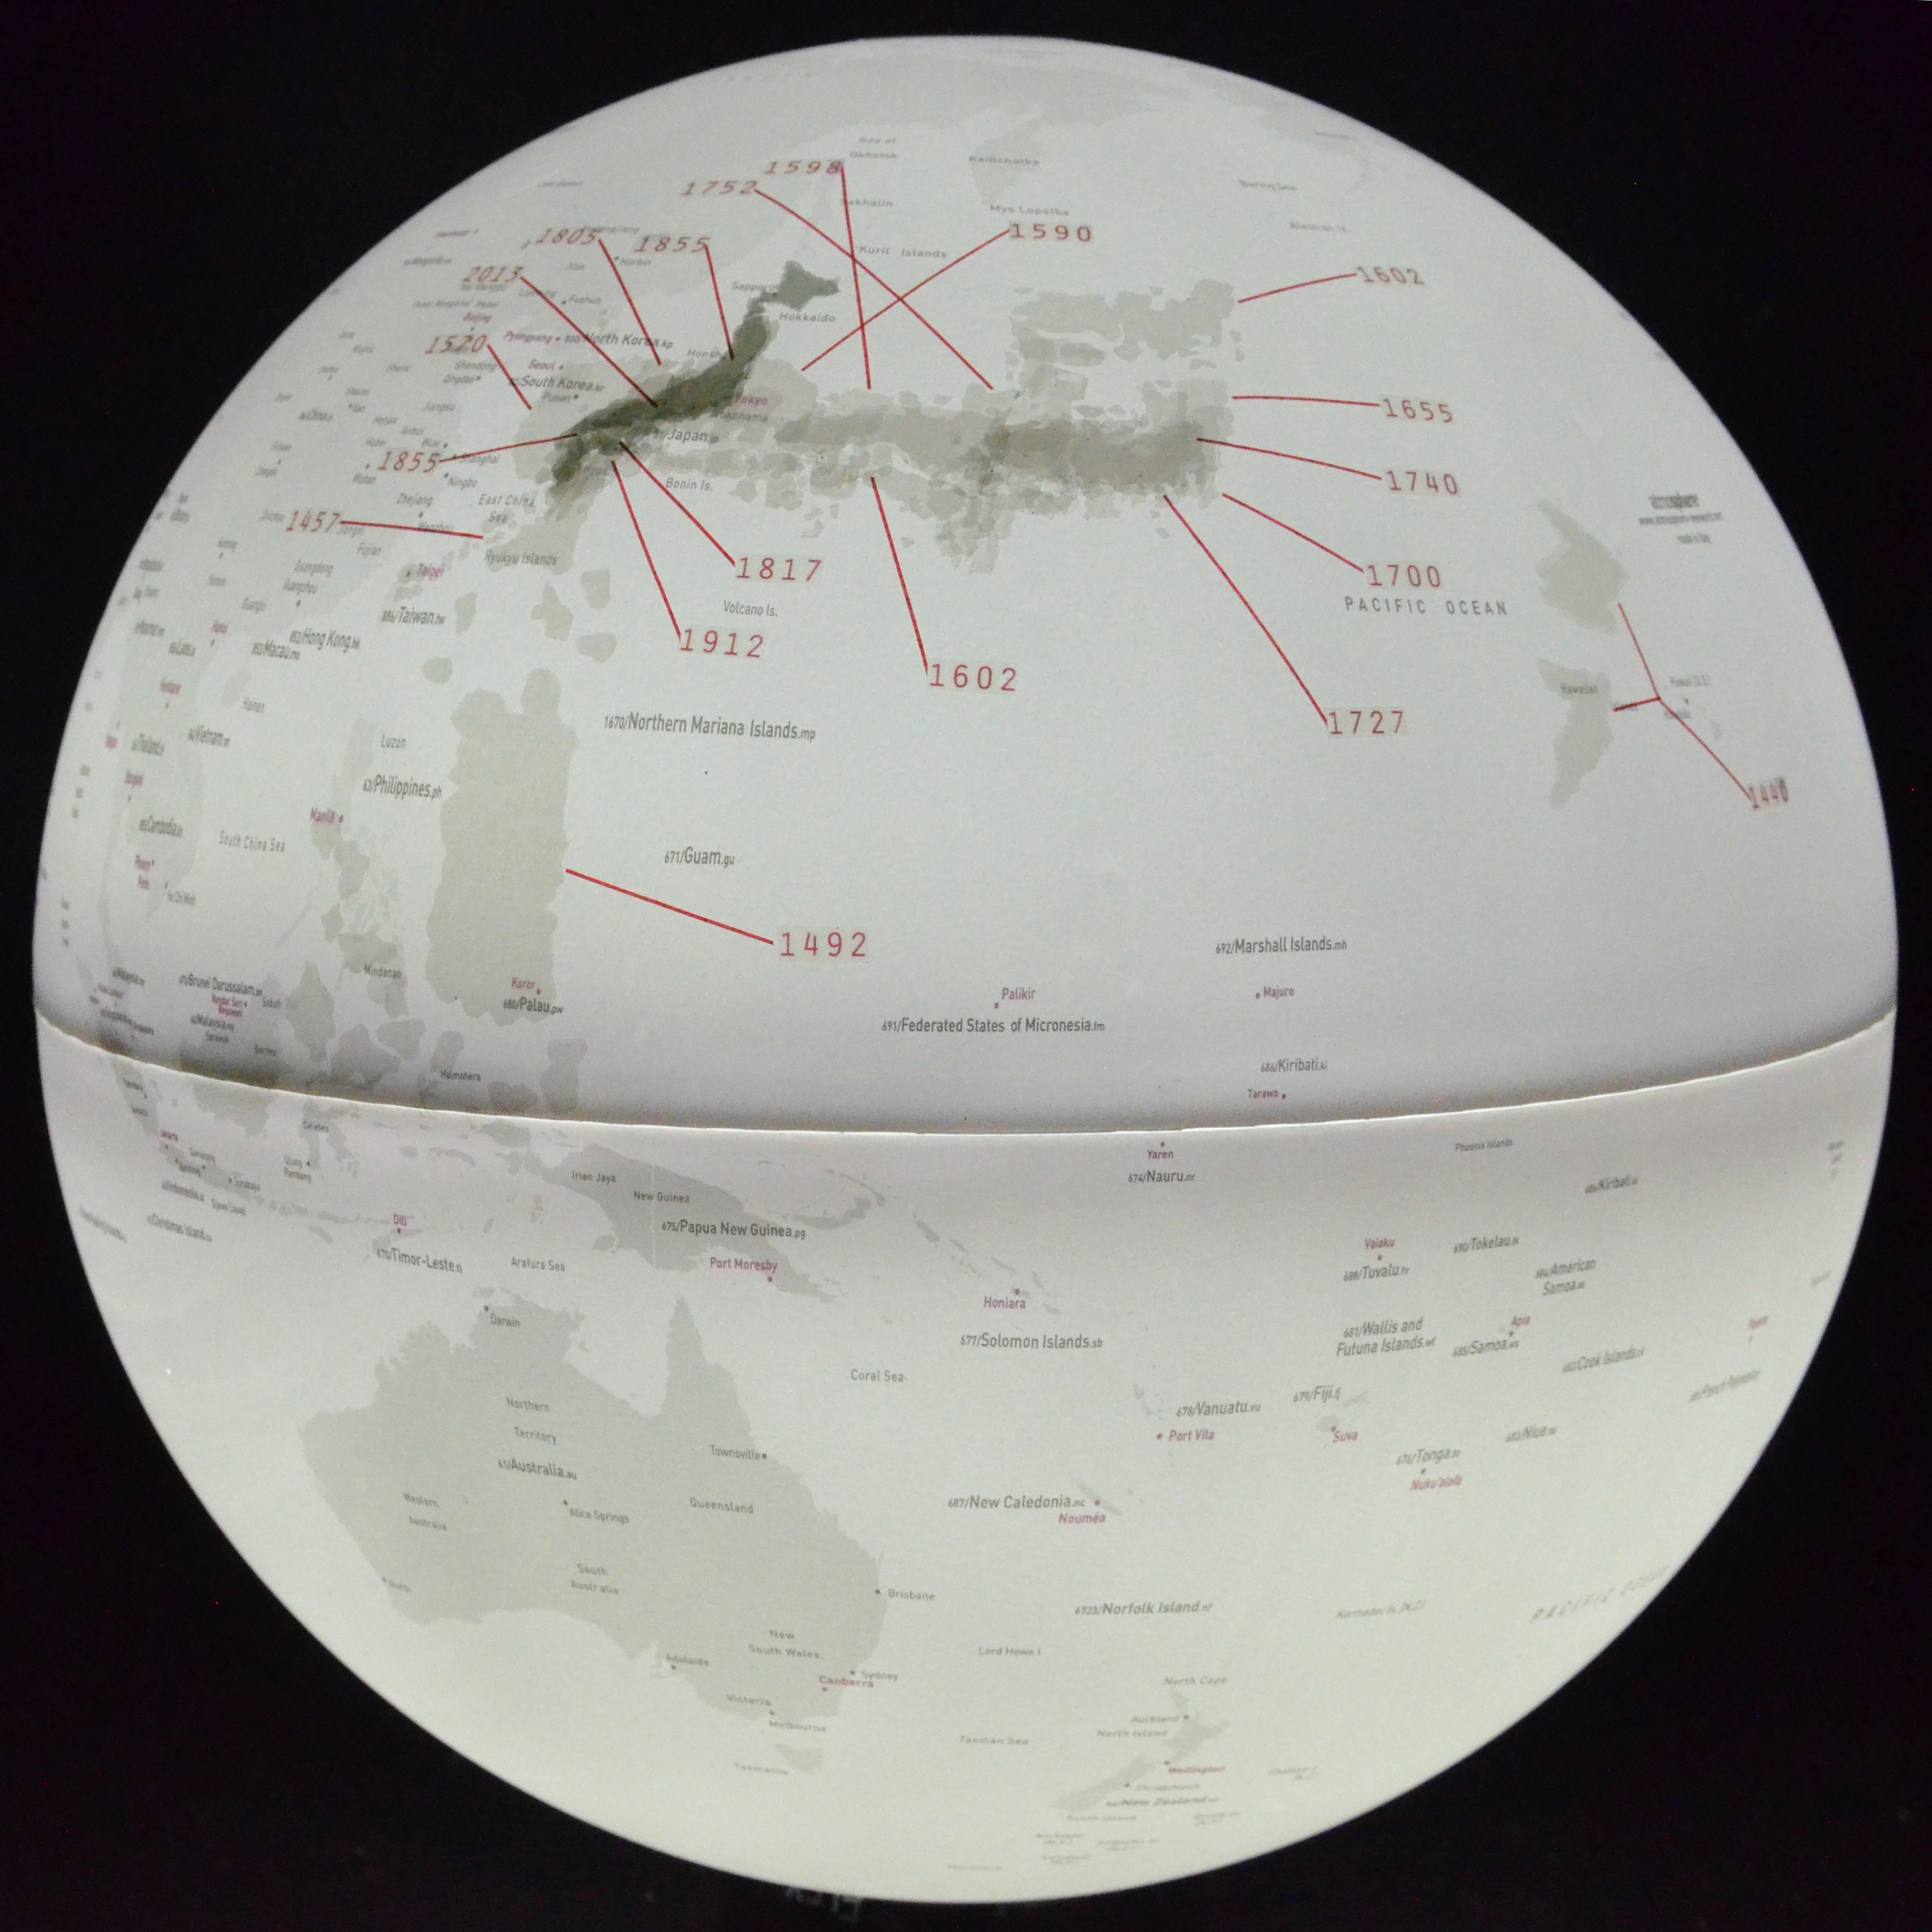
[389] Japan's Cartographic Development / 日本發展圖表, 2013
20 cartographic representations of Japan dating from 1440 through the present are shown, illustrating the various shapes, sizes, and locations that were attributed to the country during this time. Despite the variety of these representations darker areas show increasing cartographic accuracy, especially over the course of the 18th and 19th century.
採用二十張圖表呈現日本從1440年到現在的變化,說明在各個期間日本的各種形狀、大小和位置。雖然這些圖表呈現出各種不同的再現方式,但顏色較深的區域則是顯示出越趨提升的製圖精準度,這點在18與19世紀之間尤其顯著。