[347-7] Horizon of Ubiquitous Computing, 2016
Internet Protocol (IP) Addresses are assigned to network capable devices such as computers, phones, even cars. The circles surrounding each global region represent the total amount of IP addresses in that region. Countries with an over 100% increase from 2010 to 2014 are identified with an arrow pointing upwards.


[347-4] Horizon of Ubiquitous Computing, 2013
Internet Protocol Addresses are assigned to network capable devices such as computers, phones, even cars. The circles surrounding each global region represent the total amount of IP addresses in that region in 2012. The circles’ proportion of white fill represents IP addresses per capita in that region. In Europe, for example, there are as many IP addresses as inhabitants. Light blue pie charts represent the percent increase of IP addresses (2011 - 12).


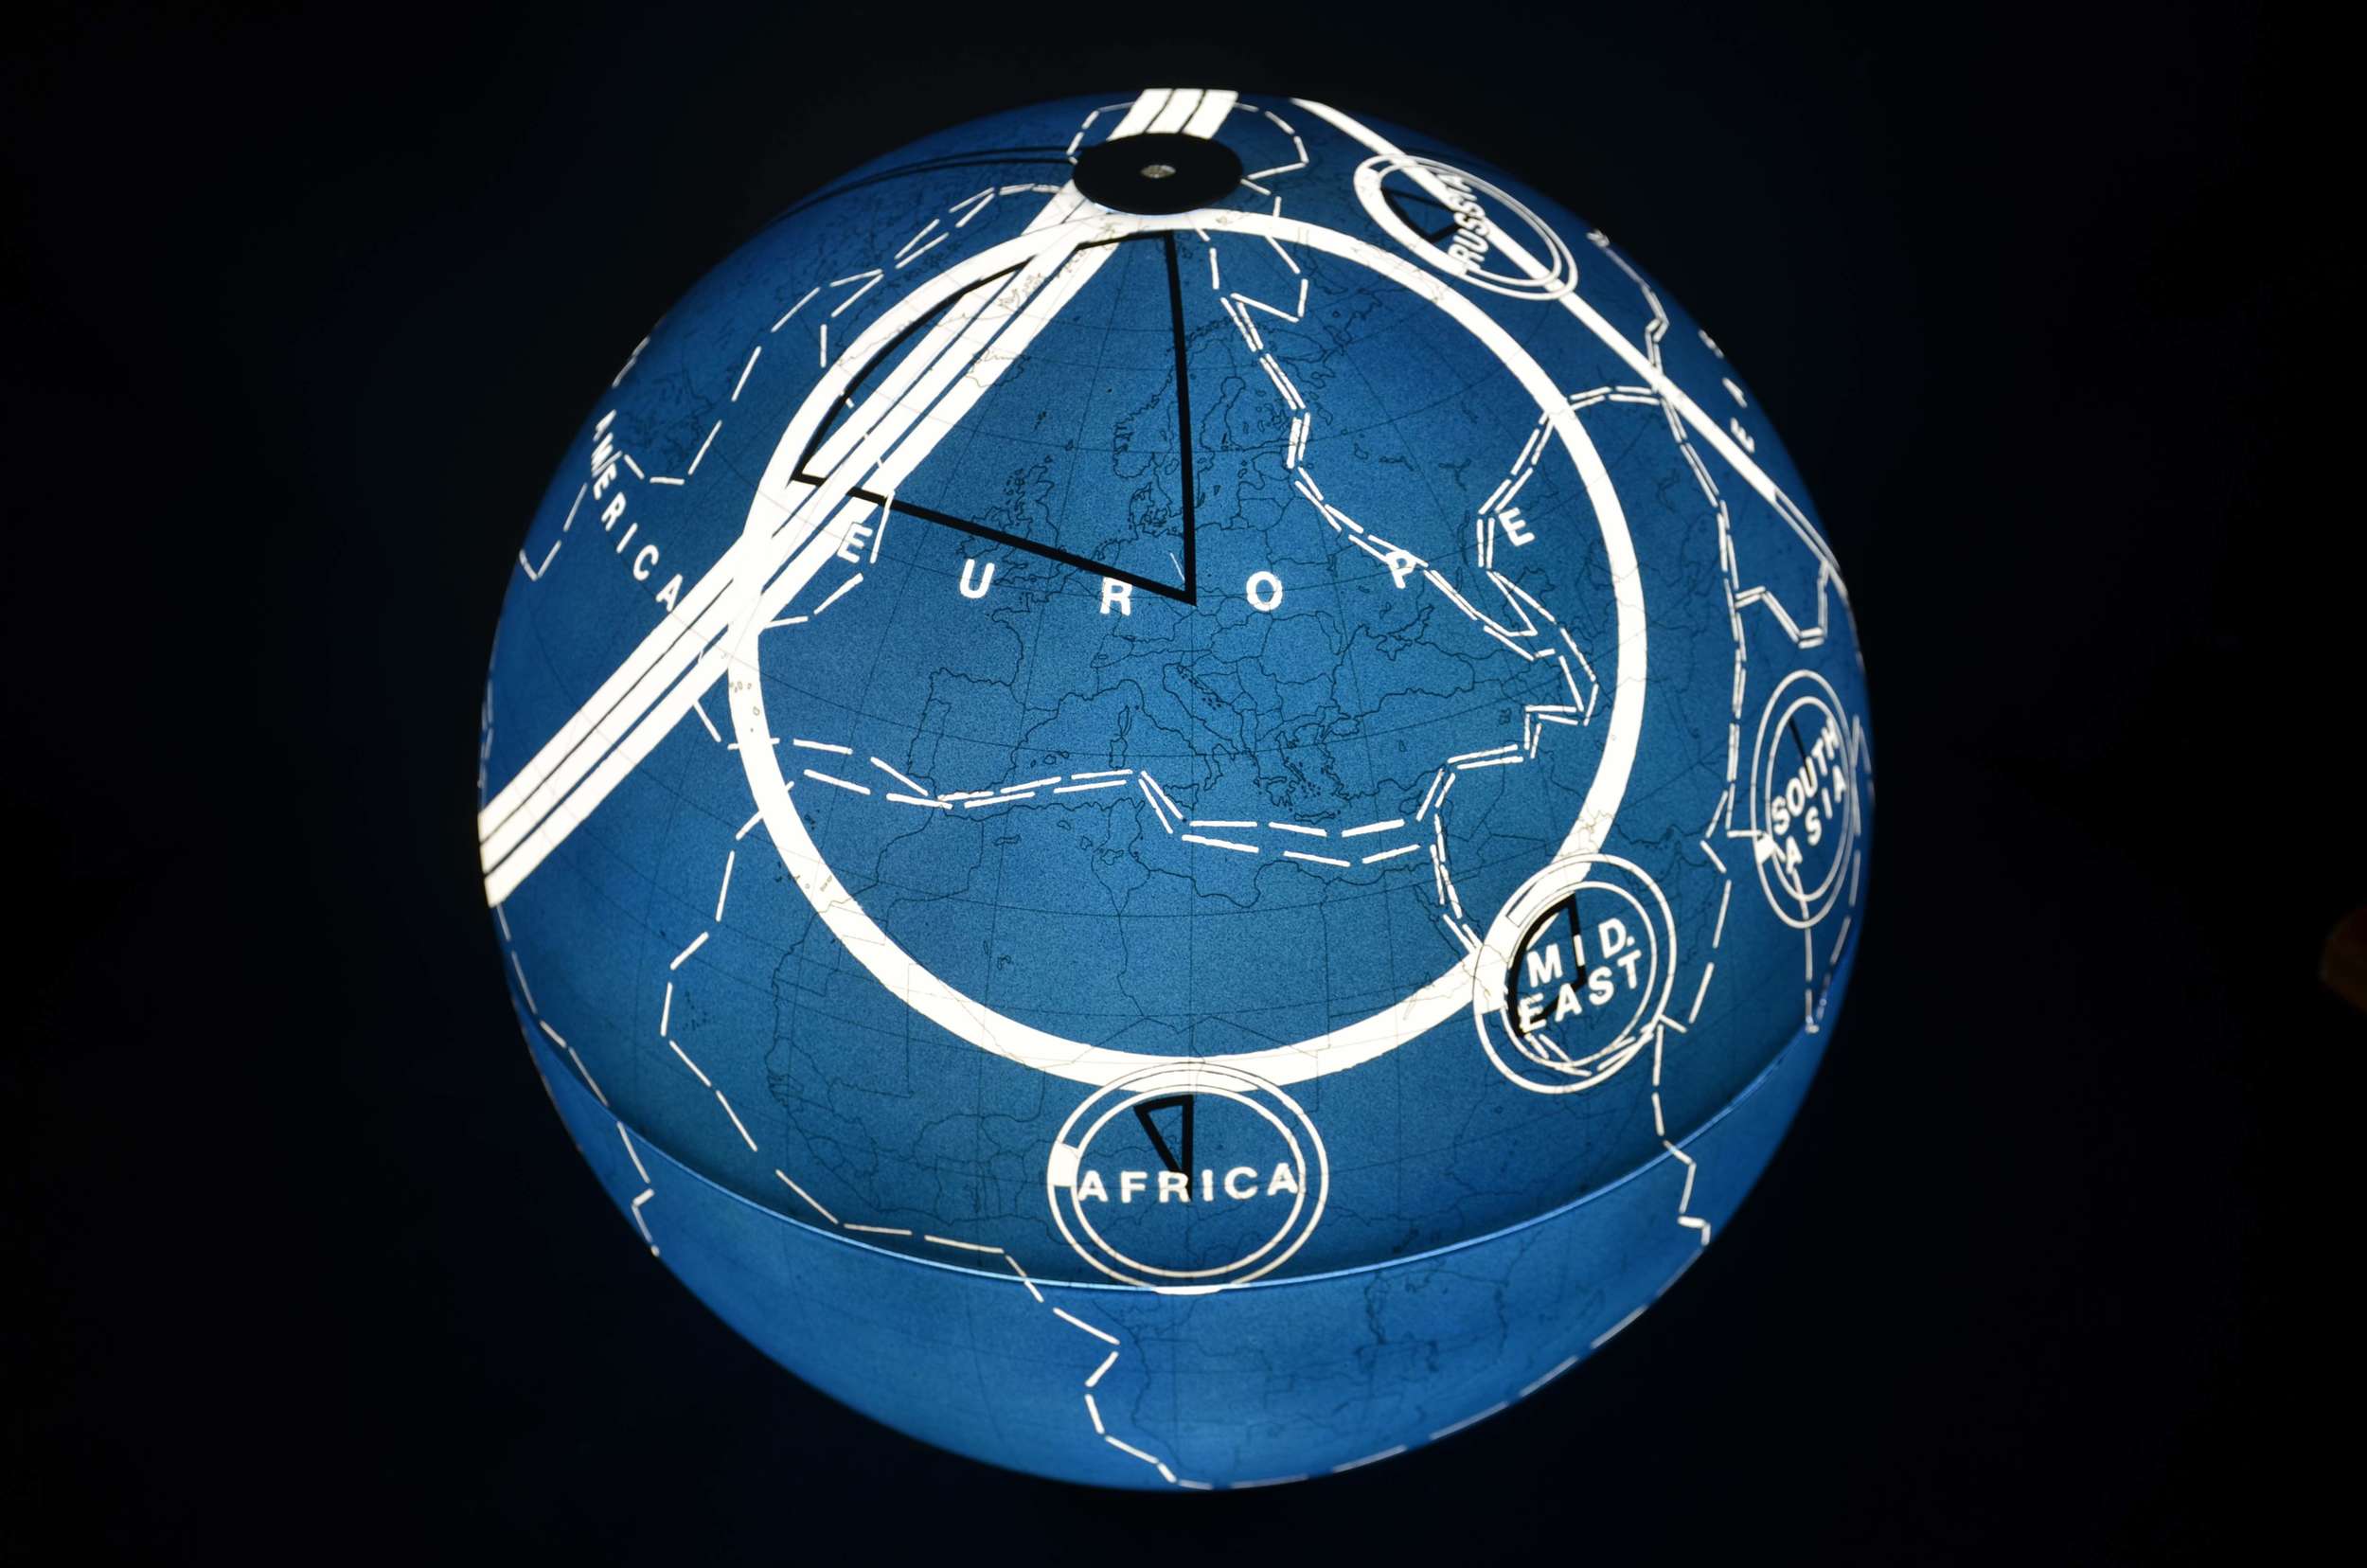
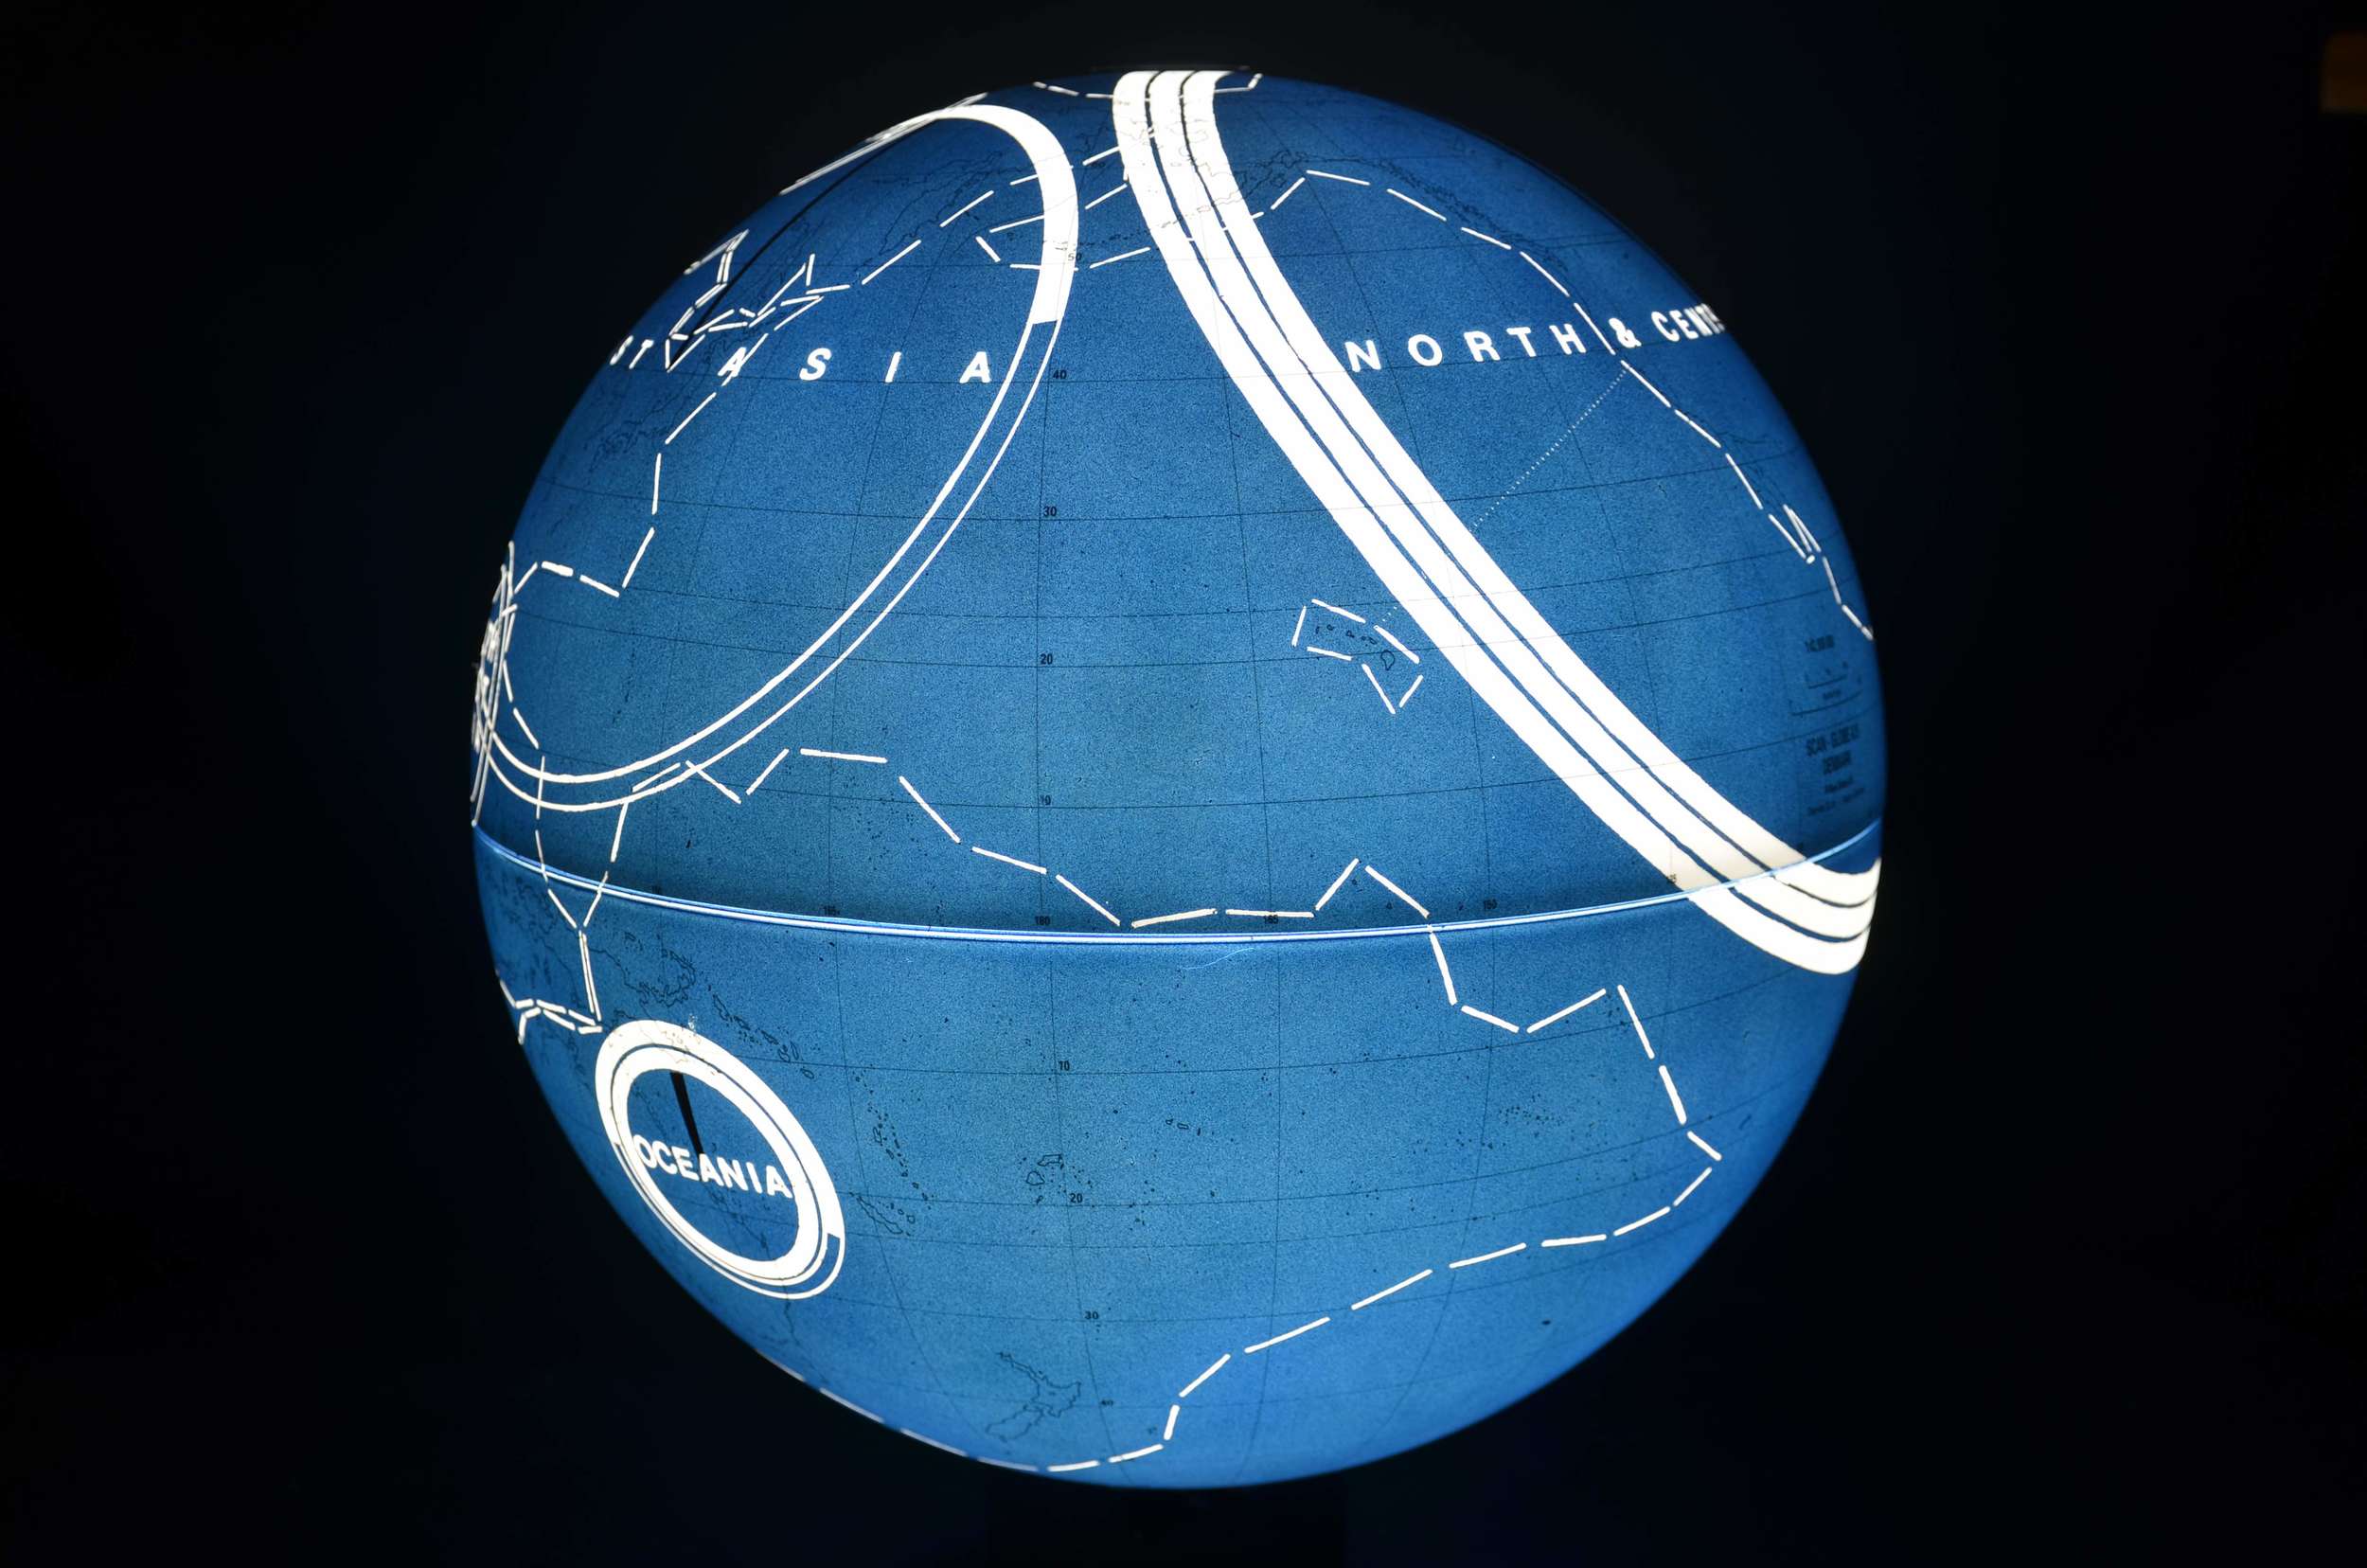
[347-3] Horizon of Ubiquitous Computing, 2012
Internet Protocol Addresses are assigned to network capable devices such as computers, phones, even cars. The circles surrounding each global region represent the total amount of IP addresses in that region in 2012. The circles’ proportion of white fill represents IP addresses per capita in that region. In Europe, for example, there are as many IP addresses as inhabitants. Black pie charts represent the percent increase of IP addresses (2011 - 12).


[347-2] IP Addresses, 2011
The diameter of the circles surrounding each global region represents the amount of IP Addresses held by that region in 2011. The amount of white fill of that circle equals the amount of IP addresses per capita.

[347] IP Address Volume, 2010
The diameter of the circles surrounding each global region represents the amount of IP addresses held by that region in 2010. The amount of white fill of that circle equals the amount of IP addresses per capita.