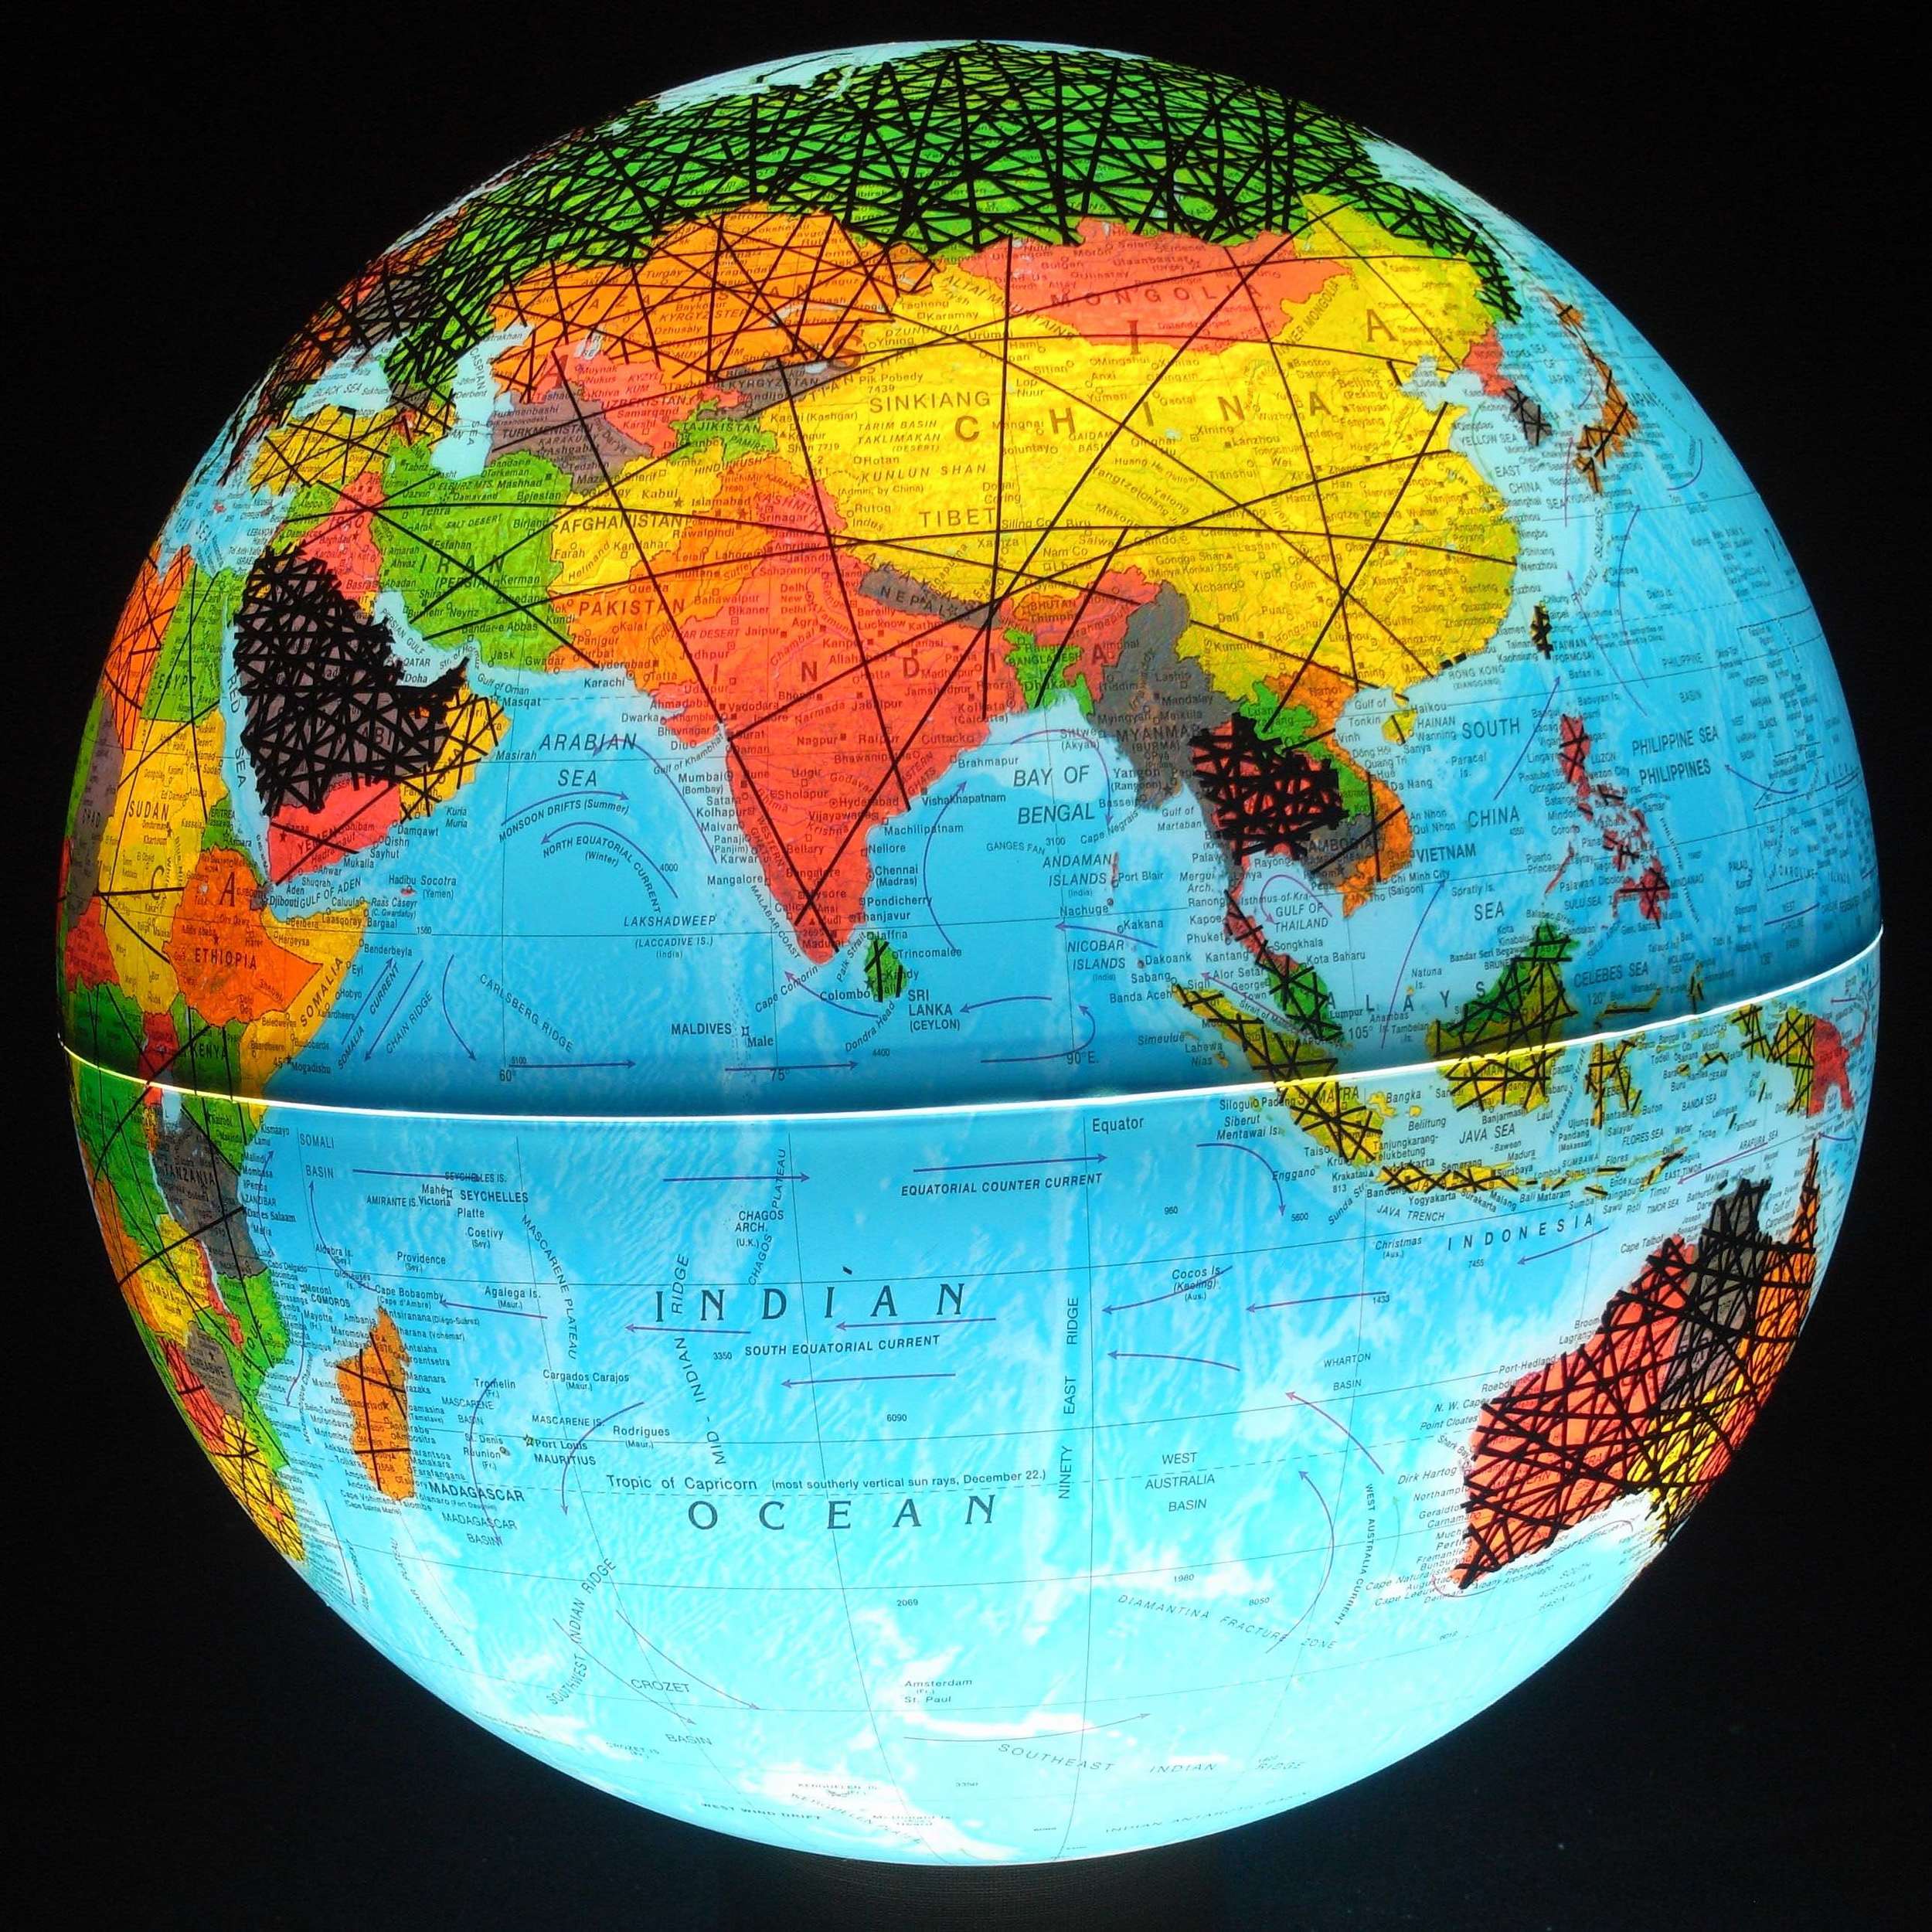
[327-5] Mobile Teledensity, 2011
Density is shown in four levels where more than 10% of the population own a mobile phone. Sparse lines represent less than 50% ownership, semi-concentrated 50% to 100%, and most dense indicate more phones than inhabitants in 2010. Countries with more than double the world's average annual growth rate (CAGR) of 23% from 2002 - 2009 are encircled with bright lines. Since 2023 mobile devices outnumber the world’s population.
Teledensidad móvil
La densidad se muestra en cuatro niveles en los que más del 10% de la población posee un teléfono móvil. Las líneas poco densas representan menos del 50% de propietarios, las semiconcentradas del 50% al 100%, y las más densas indican más teléfonos que habitantes en 2010. Los países con más del doble de la tasa media de crecimiento anual (CAGR) mundial del 23% entre 2002 y 2009 están rodeados de líneas brillantes. A partir de 2023, los dispositivos móviles superarán en número a la población mundial.
[327-4] Mobile Teledensity, 2009
Mobile phone density is shown in four levels: Countries where people have less than 10 phones for 100 people are not covered; 10 to 50 phones per inhabitants are lightly crisscrossed; 51 to 99% is the next step and countries with more mobile phones than citizens have the highest density.
[327-3] Mobile Teledensity, 2009
Mobile phone density is shown in four levels: Countries where people have less than 10 phones for 100 people are not covered; 10 to 50 phones per inhabitants are lightly crisscrossed; 51 to 99% is the next step and countries with more mobile phones than citizens have the highest density.


